Categories
Uncategorized

Applying the Lessons of Jonah

  The Goal is often touted as one of the most important business books of all time, yet many of the key principles are not widely applied in business process management. In The Goal, Eliyahu Goldratt describes his Theory of Constraints through a fable where the protagonist, a manufacturing plant manager named Alex is guided through the recovery of his plant by his old physics professor turned business consultant, Jonah. Jonah appears throughout the story to teach Alex in Socratic style to solve the underlying problems of his plant’s operations. In the end of course, the plant is saved and Alex is promoted.

The underlying principles of Constraint Theory are key to analyzing any process. But, it often takes a bit of a leap to apply lessons from manufacturing process to the less tangible world of business transaction based processes. In manufacturing, the process is visual. Inventory is physical. Throughput can be counted in widgets produced and sold. But in business processes, these things can be difficult to identify, see and count. I believe here in lies the rub for Jonah (and Lean for that matter).

With Jonah’s guidance, Alex comes to realize that the management metrics he uses to manage daily operations are all wrong. He discovers that the goal is not to improve efficiency, increase resource utilization or control costs, which are some of his current measures. The goal of any business is to MAKE MONEY…period. Therefore, all metrics must be in the context of contribution to that overall goal for the company. Also, Alex’s metrics were all focused on optimizing individual parts of the system; the sub-processes. Metrics that encourage optimizing sub-processes can be detrimental to the performance of the larger system. So, measurement must be focused on the performance of the system.

I struggled with two foundational problems when thinking about how to apply the Constraint Theory principles in my work. First, I’m almost never working on a production process that directly affects sales. For example, how does one equate the process of approving and paying employee expense reports to The Goal of making money? Second, Jonah focuses Alex on optimizing the whole system above individual processes. But, I’m never working at the “plant” level, always at the sub-system process level. Not sure what Jonah would say about these two challenges but here’s how I wrap my brain around them.

I redefine the goal in the context of the process I’m focused on. Think of the process itself as a stand alone business. Using the expense report process as an example. If the expense report process were a business, then the business would presumably be paid for accurately reimbursing employees for expenses. So, again as a business, reimbursing employees is what makes money so, the goal in this case is to accurately reimburse employees.

By putting the goal in context this way, you address both challenges. First, you can now show impact on ‘sales’ of the process. Second, you can now work at a system level since the scope of the system is now any process or sub-process that supports the activity of accurately reimbursing employees (the goal). Maybe this is painfully obvious to most but it helps me define what I’m working on at my level.

Categories
Uncategorized

Waste of Extra Processing in Business

The most common waste that I find in business processes is the waste of extra processing.  Extra processing remember is the act of touching things more than once.  In manufacturing processes, overproduction may be the greatest of all waste sins, but in business processes, extra processing is rampant and right under our noses every day.  The good news is, it’s not terribly difficult to find.  The bad news is, it can be difficult if not impossible to eliminate.  But, put first things first by learning to see extra processing and recognize it for what it is; waste.

Flow Diagrams

The first thing I look for in a workflow diagram are loop backs.  You know, the diamond shape that indicates a decision.  Things like, “Report Complete?” or “Amount in Range?” or “ID Correct?”.  If YES, the process proceeds but if NO, the process loops back to a previous step.  Dig in here.  There is extra processing going on.  Look upstream in the process to find where changes can be made to prevent the loop back (NO) condition.  How far back does the loop go in the process?  If the loop back spans multiple previous steps requiring those steps to be repeated, look for ways to move the decision point further up stream.

Key Words

Look for words in process descriptions that indicate the act of “checking”.  Words like, review, approve, authorize, check, test, governance, oversight, audit all hint at wasteful activities.  That is not to say that they can be eliminated, but they are indicators of process areas that should receive scrutiny because they are non-value add.  The people involved in these activities are a gold mine of waste.  They can tell why things are rejected, or fail tests, or don’t get approved.  They are the keys to developing business rules that can be applied upstream that reduce the failure rate and therefore reduce extra processing.

Remember that both the act of checking and the act of correcting (rework) are both the waste of extra processing.  Applying business rules upstream in the process reduces both the burden of checking and the waste of rework.  A simple example might be an automatic approval for expense reports under a certain amount.  This reduces the number of reports that are reviewed and reduces the number of reports that will require revision and resubmittal.  Look around for the waste of extra processing.  You’ll soon begin to trip over it.


Categories
Uncategorized

Everyone Should Learn BPMN

Ok ok…maybe not everyone, but, if you need to convey the nuances of complex business process with precision and brevity, Business Process Model and Notation (BPMN) is worth taking a look at.  Here’s why I love BPMN and use it almost exclusively to capture even the simplest of processes in an elegant drawing.

BPMN is Compact

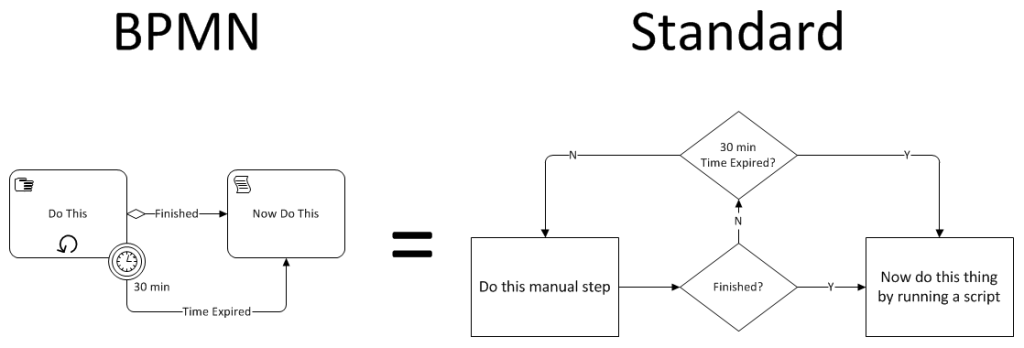
You can say a lot in a very small space.  Take a look at this example…

BPMN Compare

Both drawings depict the same process.

  1. Do some manual step repeatedly until finished or until 30 minutes has elapsed
  2. Then run a script to complete the next step

The BPMN drawing on the left depicts in the first shape that the step is manual (the hand icon) and that it is to be repeated (the recursive arrow), that there is a time limit (the clock icon on the shape border).  The standard drawing on the right, uses three shapes to convey the same instructions.  This may not seem to be a significant difference in this example, but over the course of a process with hundreds of steps and multiple conditional branches, this conservation of space is critical to developing a clear vision of the workflow.

BPMN is Precise

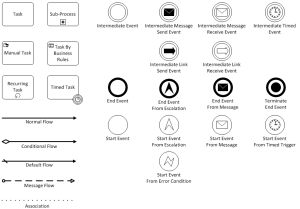
There is little room for ambiguity.  The rules for BPMN are specific and, while the specifications offer alternative representations, within each construct, the rules are clear.  Where a standard drawing relies on the author’s ability to describe a process step, BPMN uses symbols.  Symbols are universal, intuitive and language independent.  Once you learn just a few basic symbols and rules, it is far easier to see a process at a glance without having to read through a lot of descriptive text.  Here is a brief legend of some of the most commonly used BPMN symbols.

BPMN Legend

Learn More

BPMN.org – The Object Management Group (OMG) controls the BPMN standard.  This is the authoritative site.

“Real Life BPMN” by Jakob Freund and Bernd Rucker describes the standard and principles in detail and gives excellent advice on demystifying BPMN for everyday use.